Best practices in Seidat to get most out of your Universal analytics

After you have enabled Google Universal Analytics in Seidat, there are a few steps you should take to improve the data collection.
If you have not yet set up Google Universal Analytics in your Seidat workspace, read this article first. NOTE! On July 1, 2023, Google Universal Analytics will stop processing data. Starting in March 2023, for continued website measurement, you should create a new Google Analytics 4 (GA4) property. Here are the instructions for GA4.
Name descriptively
Name presentations and slides as descriptively as possible.
Name the presentations used by the sales representative by using their name if you want to know how each salesperson is using their presentation.
Name the slides, so they describe what is on the page. When you check what pages the viewer has seen, you can quickly distinguish the pages that have created the most interest among users.
Use unique shared links for each recipient to differentiate each shared link viewer from another.
Search the presentation you want to find
Go to Google Analytics.
Click Behaviour -> Site Content -> All Pages from the left tab (1).
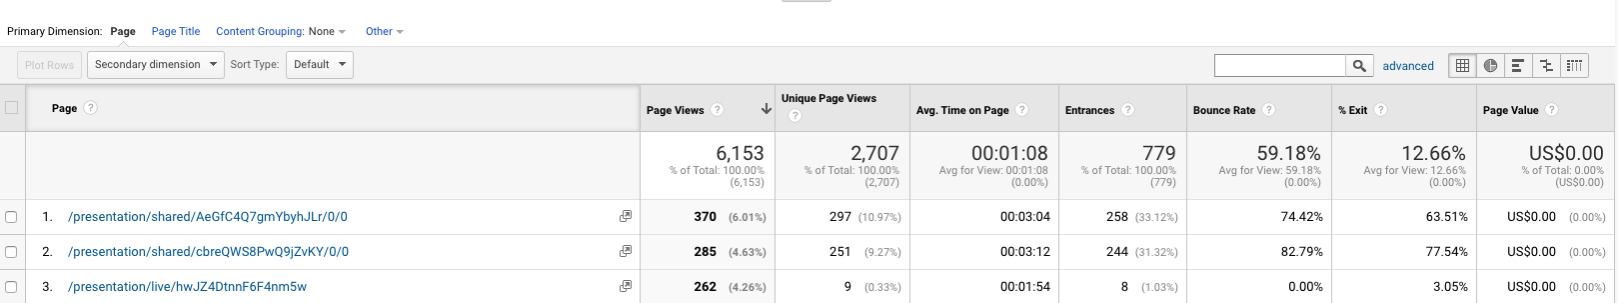
Choose "Page" or "Page Title" to search (2). With "Page," you can search any URL of your Seidat presentation. This will let you send a Seidat Link to a customer and search how the link has been opened and what behavior the customer has done with the presentation (second picture). With "Page Title," you can search by Seidat presentation name (3). You can see, for example, how your sales presentions have been used.
Copy-paste the link URL to the search bar if you chose "Page" or type in the name of the presentation you want to observe if you chose "Page Title."
Picture 1.

Picture 2.
Use Google Data Studio
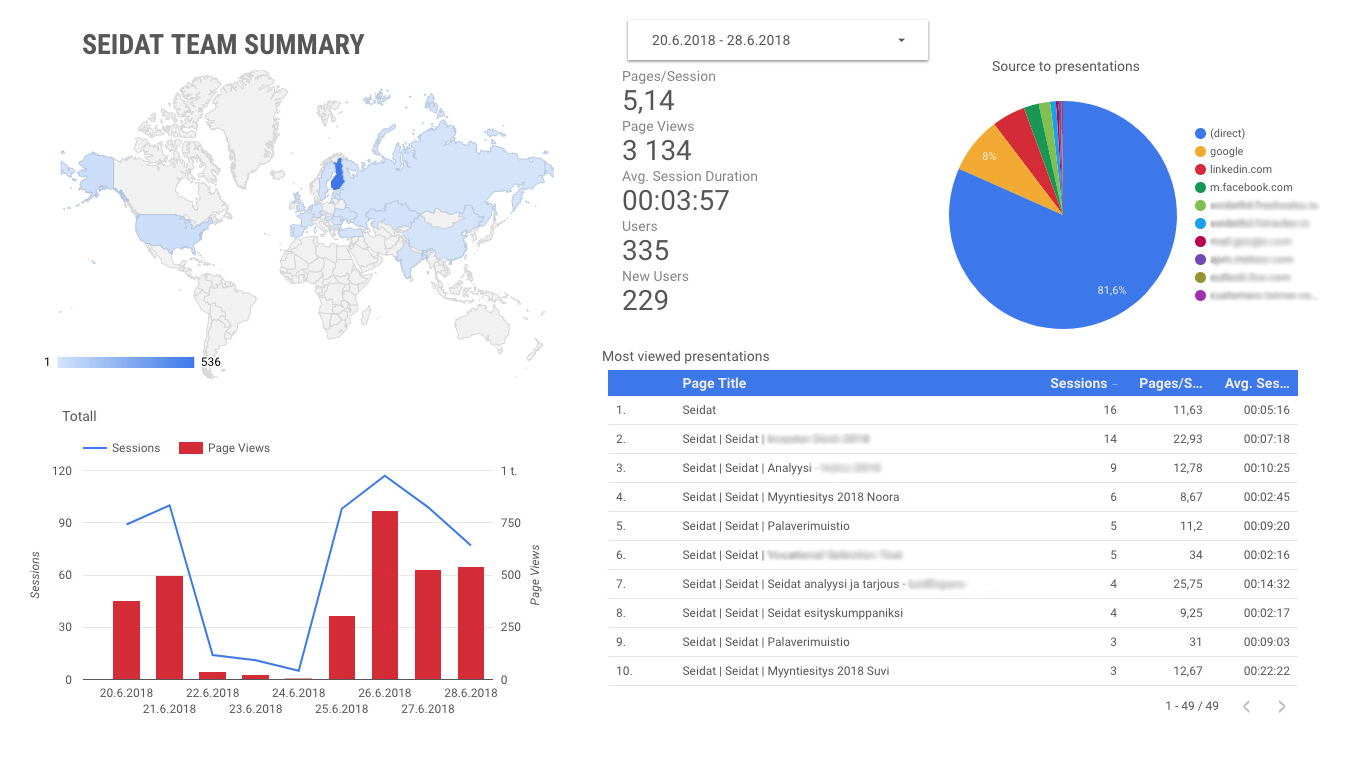
You can make easily readable datasets in Google's Data Studio from Google Analytics data. You can combine multiple sources of Google Analytics data with the Google Data Studio datasets.
You can see with a glance:
Where in the world have your presentations been viewed
What days have been the busiest
How many pages have been viewed per session
How many total page views
Average session duration
How many persons (users) have viewed the presentations, and how many are new users?
Sources for the presentations
Most viewed presentations and pages.
And much more.
If you wish to get the best result from your Google Data Studio, please contact us, and we can help.
Screen capture of our workspace's view of our datasets. This view can be easily modified to look and feel more suited to your company's needs.